
How to Look Up San Francisco County Jail Population Data
San Francisco jail population data lives in two main places. The first is the Sheriff's Office home page, which shows a live jail count, a community programs count, and prior-day booking and release totals. The second is the Sheriff's current and historical jail data page, which links out to longer reports and Board of State and Community Corrections data. The home-page snapshot refreshes daily. The historical page is the place to pull multi-year trends.
For year-over-year context, the cleanest source is the city's FY24 Annual Performance Report. That report gives the average daily population, the rated capacity, and the share of capacity used. State and national rates per 100,000 come from the Bureau of Justice Statistics and the Vera Institute. A jail count from the Sheriff page is a one-day snapshot; a city-report figure is a fiscal-year average. Both are official, and they answer different questions.
The Sheriff hosts a single page with reports and oversight data for the public. The current and historical jail data page links to the Board of State and Community Corrections feeds and annual reports.
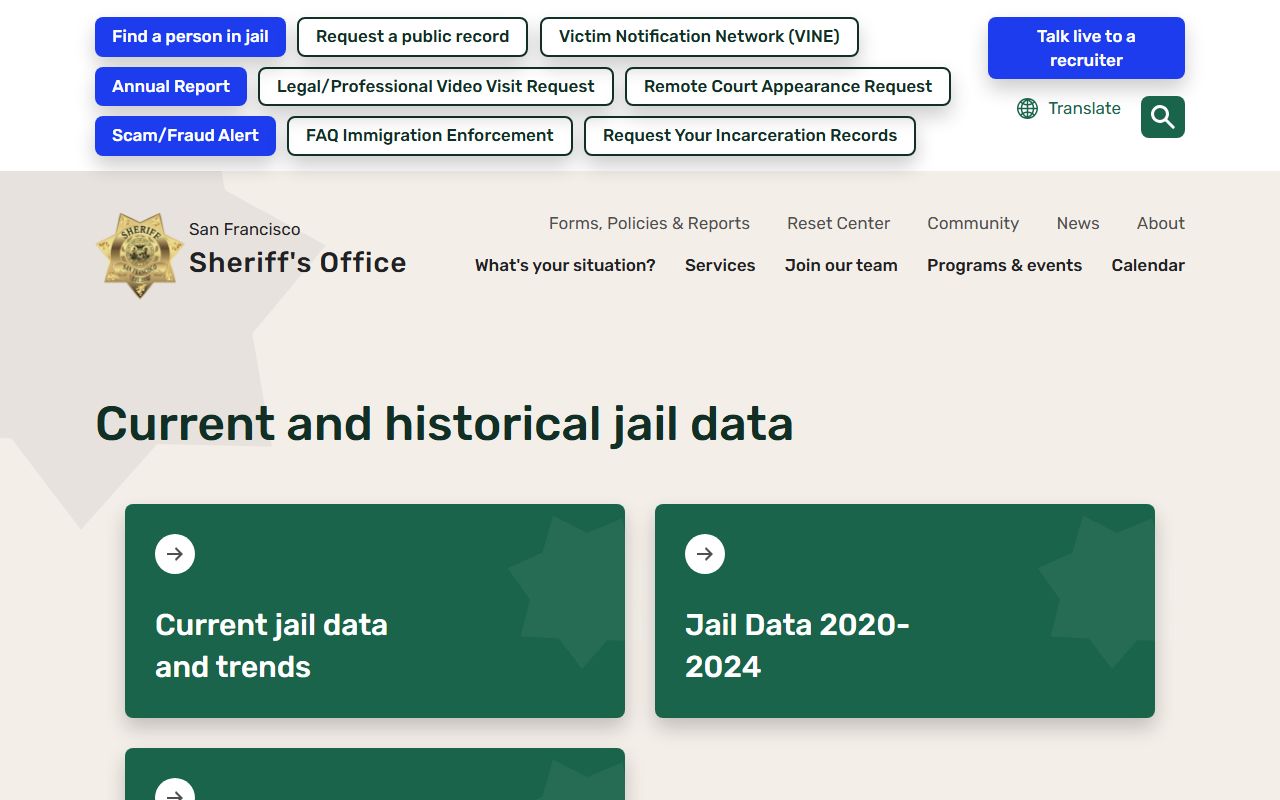
Pull a multi-year trend from this page rather than from any one-day snapshot of the San Francisco County jail count.
San Francisco County Jail Capacity Overview
San Francisco runs its custody system out of a small set of facilities under the Sheriff. The booking center sits at 425 7th Street, which is County Jail #1. Housing is split between County Jail #2 at the same address, County Jail #4 at the Hall of Justice, and the San Bruno facility named County Jail #3 on the current Sheriff site and County Jail #5 on older mobile pages. Capacity figures come from the Sheriff's mobile facility pages and the city's annual performance report. Per the FY24 Annual Performance Report, system-wide rated capacity was 1,284 beds in FY24 and 1,384 beds in FY23.
| Facility | Rated Capacity | Source |
|---|---|---|
| County Jail #2 (425 7th Street) | 392 | Sheriff mobile facility page |
| County Jail #4 (Hall of Justice, 850 Bryant Street) | 402 | Sheriff mobile facility page (legacy; verify current status) |
| County Jail #5 / San Bruno (1 Moreland Drive) | 768 | Sheriff mobile facility page |
| FY24 system rated capacity | 1,284 | SF Annual Performance Report |
| FY23 system rated capacity | 1,384 | SF Annual Performance Report |
Jail Wards 7D and 7L at San Francisco General Hospital at 1001 Potrero Avenue are also part of the custody footprint, but those are locked hospital wards, not standard jail beds. County Jail #1 has no housing; it handles booking and release only. The current Sheriff site puts the most weight on County Jail #2 and County Jail #3, so the 402-bed line for County Jail #4 should be read as a legacy capacity figure pending current confirmation.
Average Daily Population
Average daily population, or ADP, is the figure city budget and oversight staff use to plan jail staffing and bed needs. The FY24 Annual Performance Report sets San Francisco's FY24 ADP at 1,099 people. That was a 34% jump from the FY23 figure of 818. It put FY24 close to the FY20 figure of 1,091, which was the last year before pandemic social distancing pulled the jail count down. Occupancy moved with it. The same report puts FY24 ADP at 86% of the 1,284-bed rated capacity, up 27 percentage points from 59% in FY23, when capacity was 1,384.
FY24 is still below the pre-pandemic baseline. The report cites a six-year FY14 through FY19 ADP of 1,291, which puts FY24 at 14% below that older average. For a current single-day count, the Sheriff's home page is the right source. One captured snapshot showed 1,301 at 0500 on October 28, 2025, alongside 38 bookings and 54 releases the prior day. Those figures move daily.
Demographic Breakdown
Demographic detail on the local jail population is thin on the Sheriff's public pages. The inmate locator returns a person's name, age, and facility, but not race, gender breakdown, or ZIP. For population-level demographics, the Sheriff's historical jail data page and Board of State and Community Corrections quarterly reports are the right sources. For long-run county-level patterns, the Vera Institute incarceration trends tool tracks race and gender shares for San Francisco County.
The FY24 Annual Performance Report tracks total jail population by year and the share of rated capacity used, but does not publish a single race-and-gender table. County Jail #2 is the only San Francisco jail that houses women, so the housing-by-gender split runs through that facility plus the hospital wards.
| Group | Source |
|---|---|
| Gender (men vs women) | Sheriff historical jail data / BSCC report |
| Race / ethnicity share | Vera Institute incarceration trends (county level) |
| Age distribution | Sheriff historical jail data |
Note: Demographic numbers must be pulled fresh from the Sheriff's historical jail data page or BSCC reports each build, since the Sheriff does not publish a static race or gender table on a public landing page.
Pretrial vs Sentenced Population
San Francisco's jail holds two main groups: people held pretrial while a case moves through the Superior Court, and people serving local sentences after conviction. County Jail #2 is described by the Sheriff as housing both sentenced and pre-sentenced people. County Jail #4 is also described as holding sentenced and pre-sentenced people on the older facility page. The split itself is not published in a single line on the Sheriff site, so the cleanest source is the Board of State and Community Corrections jail profile data, which all California counties report into.
| Status | Source |
|---|---|
| Pretrial (held while case is pending) | BSCC quarterly jail profile / Sheriff historical jail data |
| Sentenced (serving local custody term) | BSCC quarterly jail profile / Sheriff historical jail data |
Statewide and nationally, the pretrial share is large. BJS reports show that more than 6 in 10 people in U.S. local jails on any given day are pretrial, not sentenced. California's pattern tracks that. The San Francisco share is shaped by local own-recognizance review at booking through the Sheriff's OR Project, by Superior Court arraignment outcomes, and by bail decisions. For an up-to-date local share, pull the latest BSCC jail profile for San Francisco before publishing.
Misdemeanor vs Felony Population
Charge level drives where a person sits in the system. A felony booking in San Francisco runs through County Jail #1 for intake, classification, and DNA collection. A misdemeanor case may be cited and released at booking under the Sheriff's cite-and-release review, or may go to the OR Project for own-recognizance release. People held in custody on felony charges make up the bulk of the housed population statewide; misdemeanor holds are usually shorter. The Sheriff's current and historical jail data page is the place to find a current local split.
The inmate locator shows charge statutes in a format like PC/F or HS/F, where the letter after the slash flags felony or misdemeanor level. That field appears in the public JSON for each charge entry, alongside the docket number and disposition. It is per-person data; it is not a population-level summary. For a population-level felony vs misdemeanor count, the BSCC jail profile and the Sheriff historical data page are the right sources.
Mental Health and Medical Population
San Francisco runs medical and mental health care inside the jails. County Jail #2 has its own infirmary, dental office, and medical observation pod, with 24/7 care per the Sheriff's facility description. The San Bruno facility has an infirmary, dental office, 24/7 medical care, and a sheltered living unit for people with psychiatric needs. The most acute cases go to Jail Wards 7D and 7L at San Francisco General Hospital. Ward 7D is for medical hospitalization; Ward 7L is for psychiatric hospitalization.
Population-level numbers for mental health and medical holds are not posted as a public table on the Sheriff site. The Sheriff lists Jail Health Services at 415-554-7225 for medical, dental, or psychiatric concerns. The public information line for inmate status is 415-553-1430. For a count of people on the mental health caseload, the Sheriff's historical jail data page and the city's Jail Health Services are the right channels.
National and State Context
National and state jail rates give the San Francisco numbers a frame. BJS publishes an annual report on jail inmates that includes the national rate per 100,000 residents and state-level rates. The Vera Institute county-level tool publishes per 100,000 figures for individual counties, including San Francisco. The Prison Policy Initiative explains the difference between jail and prison populations, which matters because the Sheriff runs jails while CDCR runs state prisons. The table below is a frame for those three figures. Pull the current numbers from BJS, Vera, and Sheriff data before publishing; the cells should not be left blank in production.
| Level | Jail Population per 100,000 | Source |
|---|---|---|
| San Francisco County | Pull from Vera Institute county tool | Vera incarceration trends |
| California (statewide) | Pull from BJS Jail Inmates report | Bureau of Justice Statistics |
| National | Pull from BJS Jail Inmates report | Bureau of Justice Statistics |
Note: The San Francisco figure is county-specific; the California and national figures are state and national rates and are not local to San Francisco.
The Bureau of Justice Statistics publishes the state and national jail-population series. The Bureau of Justice Statistics home page hosts the Jail Inmates report and related custody data sets.
Pull current state and national rates from BJS before comparing them with the San Francisco County jail population.
The Prison Policy Initiative explains the jail and prison split, which matters for how San Francisco numbers should be read. The Prison Policy Initiative home page covers pretrial share, jail vs prison, and racial-disparity data.
Use PPI to frame the San Francisco County pretrial vs sentenced split against statewide and national trends.
Population Trends Over Time
The clearest multi-year story for San Francisco runs through the FY24 Annual Performance Report and the Sheriff's historical jail data feed. FY20 average daily population was about 1,091 per the FY24 report comparison. FY21 through FY23 saw a large drop tied to COVID-era social distancing inside the jails and to broader changes in case handling. FY23 hit a low point with an ADP of 818 and 59% of rated capacity used. FY24 climbed back to 1,099, with 86% of rated capacity in use. The longer-run FY14 to FY19 baseline of 1,291 sits above all of those years.
- FY14-FY19 baseline: ADP about 1,291 (SF Annual Performance Report).
- FY20: ADP about 1,091.
- FY23: ADP 818; 59% of 1,384-bed rated capacity used.
- FY24: ADP 1,099; 86% of 1,284-bed rated capacity used.
- 2025: Sheriff snapshot counts show the jail population sitting closer to rated capacity; pull the current count from the Sheriff home page.
The 2025 picture is best read off the Sheriff home page, since the count moves day to day. One captured snapshot showed 1,301 at 0500 on October 28, 2025. That is an example, not the current number. The Sheriff also publishes a community programs count (1,946 in that same snapshot), which is people on non-custody alternatives and is separate from the jail count itself.
Searching for San Francisco County Inmate Records by Name
Name lookups for people currently in custody do not run through this page. The aggregate counts above describe the jail population as a whole. For a live name, SF number, or booking number search, use the Sheriff's "Find a Person in Jail" tool from the San Francisco County inmate records page. That page covers the search fields, the result data, and the public information line at 415-553-1430.
Where the Data Comes From
Local figures come from two official sources. The first is the San Francisco Sheriff's Office home page and its current and historical jail data page. The second is the city's FY24 Annual Performance Report, which is the source for the FY24 ADP of 1,099, the FY23 ADP of 818, the FY14-FY19 baseline of 1,291, and the FY24 and FY23 rated capacity figures.
State and national context comes from three places. The Bureau of Justice Statistics publishes the Jail Inmates series. The Vera Institute tool gives per-100,000 rates at the county level. The Prison Policy Initiative covers the jail vs prison split and the pretrial share. State prison numbers come from the California Department of Corrections and Rehabilitation and are not part of the local jail count.